|

|
|
|
APPLIANCE
RECYCLING CENTERS OF AMERICA, INC.
7400 Excelsior Blvd. Minneapolis, MN 55426-4517
|
|
TELEPHONE: (952)
930-9000
|
|
FACSIMILE: (952)
930-1800
|
January 8,
2008
Mr. Michael
Moran
Accounting
Branch Chief
Securities
and Exchange Commission
Mail
Stop 3561
Washington,
DC 20549
|
Re:
|
|
Appliance
Recycling Centers of America, Inc.
|
|
|
|
Comment
Letter dated November 21, 2007
|
|
|
|
Form 10-K
for Fiscal Year Ended December 30, 2006
|
|
|
|
File
No. 000-19621
|
Dear
Mr. Moran:
We
have received your comment letter dated November 21, 2007, with respect to
the above-referenced filing by Appliance Recycling Centers of America, Inc.
As
requested, we are providing the following responses and supplemental
information. To facilitate your review
of our responses, we have set forth below the full text of each comment,
followed by our response thereto.
Report of Independent Registered Public Accounting Firm, page 31
1. Please have your
independent accounting firm tell us what consideration was given to the fact
that you were in violation of your debt covenants at the time they opined on
your financial statements on March 16, 2007. We note the waiver was not obtained from your
lender until March 28, 2007 subsequent to the audit report date of March 16,
2007.
Response
from our accounting firm: The existence
of the covenant violation was considered at the time we opined on the Company’s
financial statements but had no impact on the dating of the audit report due to
the existing demand feature of the instrument.
Report of Independent Registered Public Accounting Firm, page 32
2. Please clarify
which audit report provides assurance for each individual period included in
Schedule II on page 52. The
McGladrey & Pullen audit report refers to the year ended January 1,
2005 while the Virchow, Krause & Company, LLP does not refer to any
periods presented.
Also, please tell us why the schedule does not include an
annual balance as of December 31, 2005.
Response: Virchow, Krause & Company, LLP
audited both the 2005 and 2006 fiscal years.
Data from both 2005 and 2006 should have been included in Schedule II on
page 52, and will be included in future filings.
Consolidated Balance Sheets, page 33
3. Please add a line
item to correspond with Note 5. See Rule 5-02.25
of Regulation S-X.
Response: In future filings, the company will add a
line to the balance sheet corresponding to Note 5, “Commitments and
Contingencies.”
Consolidated Statement of Income, page 34
4. Please separately
present cost of revenue to be consistent with revenues. See Rule 5-03(b)2 of Regulation
S-X. Alternatively, please tell us why
it is impracticable to separate, identify or reasonably allocate a significant
amount of the costs disclosed as cost of revenues.
Response: Many of the company’s employees and assets
are used in both retail and recycling activities. This makes it impractical for the company to
identify costs associated with each activity.
Byproduct revenue, for example, is generated from both retail and
recycling activities as the company’s retail stores offer free removal and
recycling of the customer’s replaced appliances. The company does not generate
separate financial statements reporting on the different activities.
Consolidated Statement of Cash Flows, page 36
5. Please revise your
disclosure to clarify why the line of credit cash flows are eligible for net
reporting. You disclose this line of
credit has a stated maturity date of one year and requires minimum monthly
interest payments. In your response
please include your consideration of the net reporting requirement that debt be
due on demand or have a stated maturity of three months or less to be reported
net. See paragraph 13 of SFAS No. 95. Alternatively, please tell us you will
present the cash flows on a gross basis in future filings.
Response: As stated in Note 2, the lender may demand
payment in full of the entire outstanding balance of the loan at any time,
therefore we determined it qualifies for net reporting under FAS 95 paragraph
13, footnote 3.
6. The cash flow
statement shows long-term obligation payments of $260,000 yet the balance sheet
shows no net change between periods.
Help us understand the reason for these changes between periods and how
the changes are reflected in cash flows.
In your response please also explain the net change of $180,000 between
the mortgage balances and capital leases shown in Note 3.
Response: The Company reported non-cash financing for
new capital leases in the amount of $260,000, which in 2006 coincidentally
offset the other debt payments in the same amount.
Notes to Consolidated Financial Statements, page 37
Note 1. Nature of Business and Significant Accounting
Policies, page 37
Revenue Recognition, page 38
Product Warranty, page 38
7. Please tell us why
you combine extended warranty agreement sales with retail product sales. See rule 5-03(b) of Regulation S-X.
Response:
Extended warranty sales amounted to less
then 1.5% of total retail sales in 2006 and the amount was deemed immaterial
and therefore not split out on the income statement.
8. In future filings
please disclose the basis for recognizing revenue over the term of the
contract. We refer you to the discussion
of 12 month contracts with retained service obligations in the fourth paragraph
on page 22. Please include an
example of your revised disclosure.
Response: Here is the proposed disclosure for future
filings: The company recognizes revenue
on extended warranties with retained service obligations on a straight-line
basis over the period of the warranty in accordance with FASB Technical
Bulletin 90-1, “Accounting for Separately Priced Extended Warranty and Product
Maintenance Contracts.
9. Please tell us If
the third party service provider or the company is the named legal obligor for
extended warranty agreements where the service provider is responsible for risk
of loss or service costs. In either
scenario, please tell us your basis for revenue recognition for these
agreements and the applicable accounting guidance. Specifically please confirm you recognize the
price of the extended warranty agreement, less commission, at inception and the
basis for this treatment.
Response: The third party service provider is the named
legal obligor for extended warranty agreements where the service provider is
legally responsible for risk of loss or service costs. The company has no obligation under these
agreements and the amount the Company earns is fixed per the agreement with the
service provider, so we recognize revenue net of cost and commissions immediately
per Emerging Issues Task Force No. 99-19, Reporting Revenue Gross as a
Principal vs. Net as an Agent.
Property and Equipment, page 39
10. Please tell us if
retirement obligations exist, and if so how you have accounted for these costs
and how you satisfy the disclosure requirements in 22 of SFAS No. 143.
Response: The Company has no contractual asset
retirement obligations.
Software development costs, page 39
11. Please disclose
the total amount of capitalized software developed for internal use included in
each balance sheet and identify the line item that includes capitalized
software.
Response: The total amount of unamortized capitalized
software was $609,000 and $611,000 respectively for the years 2006 and
2005. These amounts are included in the
line item “equipment” under the Property and Equipment section of the balance
sheet. The Company
plans
to present this as a separate line item in with Property and Equipment per the
requirements of SFAS 86 paragraph 11a in future filings.
Segment Information, page 41
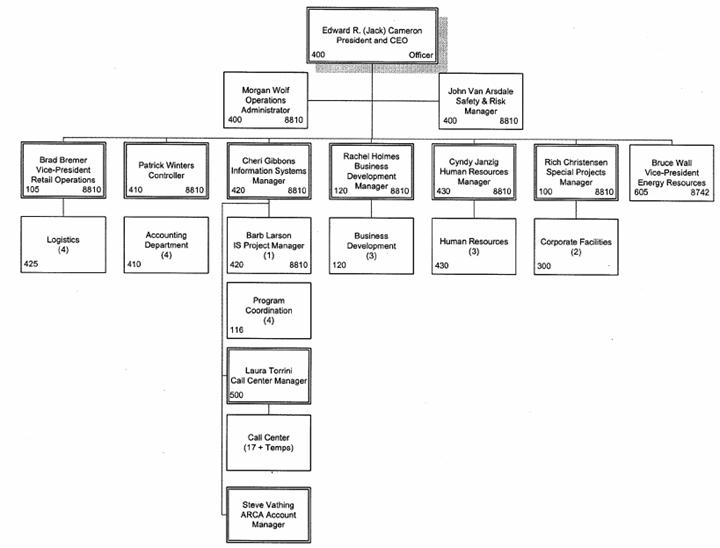
12. We observe the
filing contains many disclosures indicating the company has various unrelated
business activities and that these activities could be viewed as operating
segments which may not satisfy all of the aggregating criteria in paragraph 17
of SFAS No. 131. Please tell us how
management concluded the company has one reportable segment. In your response please provide us with the
financial information available to your chief operating decision maker (CODM)
as well as an organizational chart that describes the titles and functions of
managers within the company. In your
response please also specifically address the following:
· the dissimilarities of your
operations includes retail appliance outlets, providing recycling , reverse
logistics and byproduct activities services;
· the regulatory environment
that exists for recycling and byproduct activities but not retail stores, and
· customer dissimilarities
where retail stores serve the general public, recycling activities serves
electric utilities, reverse logistics serves appliance manufacturers and
retailers and byproduct activities serves waste haulers.
Response:
The company is managed as a single
operating unit as referenced by the attached organizational chart. The CEO is the sole chief operating decision
maker and he is not furnished with financial statements that separate the assets,
revenues, and associated costs by business activity. Revenues from recycling and by-product
activities are generated from both retail and recycling activities through
recycling services provided by the company and the free removal and recycling
of appliances through our retail stores.
Assets and staff are used in both activities and the Company does not
separate the use of these resources by activity. Financial information provided to our CEO and
management does not separate results by activity due to the multi-use nature
each location. Copies of the income statement and balance
sheet provided to the CEO and management are attached.
13. Please tell us
why you do not present the geographic segment information required by paragraph
38 of SFAS No. 131. We note you
disclose opening ARCA Canada, Inc. in 2006. To the extent your response states the
information is not material to your annual report; please tell us your
consideration of materiality with respect to subsequent interim periodic filings.
Response: The results of operations from ARCA Canada
were less than 1% of total revenues and assets for the fiscal year 2006. The company evaluates the impact of this
operation as a percent of total revenues and assets during each interim period
to determine if reporting as a separate segment is appropriate. During the first two quarters of 2007, the
results from ARCA Canada remained less than 1% of total revenues. The third quarter results were less than 8%
of total revenues.
Note 5. Commitments and Contingencies, page 44
14. We note your
recycling centers are registered as hazardous waste generators with the
EPA. Please tell us if there are any
environmental costs or obligations associated with
compliance with environmental laws for this business
activity. Tell us whether you use a
third party to dispose of hazardous waste.
Revise your disclosure here and/or MD&A as appropriate. See item 101 of Regulation S-K.
Response: The Company uses internally developed equipment
at each of our centers to recover refrigerants before any units are
recycled. The company uses only licensed
hazardous waste companies to transport, recycle or dispose of any hazardous
materials we generate. As of the balance sheet date, the company has no
environmental remediation liabilities or contingencies. We have not had any required environmental
remediation at any of our locations in the past and based on the safety programs
ARCA employs, as well as the use of only licensed companies to handle our
hazardous waste, we do not anticipate any liability associated with
environmental laws.
Note 2. Line of Credit, page 42
15. We note from your
disclosure that the payment of dividends is limited. Please expand your disclosure to state the
amount of income or retained earnings restricted and free of restrictions, as
applicable. See Rule 4-08(e) of
Regulation S-X.
Response: The agreement with our lender provides that
the company may not declare or pay any dividends, or make any distributions to
stockholders of any assets of the company.
In future filings, the company will revise its disclosure to indicate
that the agreement with our lender prohibits (rather than limits) payments of
dividends and distributions to stockholders.
Note 4. Accrued
Expenses, page 44.
16. Please explain
the facts and circumstances surrounding the accrual for recycling incentive
checks. In addition, we note the amount
of the accrual has remained the same for several periods. Please tell us when you anticipate paying the
amounts accrued.
Response: The amount accrued for incentive checks
reflects the amount of checks written in connection with our recycling program
that have not been cashed. These amounts are cleared as the checks are
presented for payment. After a period of time, these amounts will become
escheat property and be payable to the state associated with the program.
Note 7. Shareholders’ Equity, page 47
17. Please explain
the discrepancy of 500 stock options between the note and the statement of
shareholders’ equity. For example, we
note 21,500 stock options presented in this note and 21,000 in the statement of
equity for 2006.
Response: This discrepancy is due to rounding on the
equity statement. In future filings we
will present the actual number of shares throughout our filing, rather than
rounding to the nearest thousand as is done with dollar amounts.
In
connection with these responses, the Company hereby acknowledges that:
· The
company is responsible for the adequacy and accuracy of the disclosure in the
filing;
· staff
comments or changes to disclosure in response to staff comments do not
foreclose the Commission from taking any action with respect to the filing; and
· the
company may not assert staff comments as a defense in any proceeding initiated
by the Commission or any person under the federal securities laws of the United
States.
Please
contact Patrick Winters at 952-930-1782 if you have any questions about these
responses.
Sincerely,
Appliance
Recycling Centers of America, Inc.
By
Controller/Primary
Accounting Officer
Appliance
Recycling Centers of America, Inc.
Consolidated
Income Statement
For the Month
Ending November 24, 2007
|
|
|
|
|
|
|
|
|
|
|
|
|
|
|
|
|
|
|
|
|
|
|
|
|
|
|
|
|
|
|
|
|
|
|
|
|
|
|
|
|
|
|
|
|
JAN
|
|
FEB
|
|
MAR
|
|
APR
|
|
MAY
|
|
JUN
|
|
JUL
|
|
AUG
|
|
SEP
|
|
OCT
|
|
NOV
|
|
DEC
|
|
TOTAL
|
|
|
|
|
|
|
|
|
|
|
|
|
|
|
|
|
|
|
|
|
|
|
|
|
|
|
|
|
|
|
|
SALES
|
|
|
|
|
|
|
|
|
|
|
|
|
|
|
|
|
|
|
|
|
|
|
|
|
|
|
|
|
Boxed-New
|
|
$
|
2,754,729
|
|
$
|
2,974,453
|
|
$
|
3,925,281
|
|
$
|
2,723,917
|
|
$
|
2,733,779
|
|
$
|
3,976,075
|
|
$
|
2,774,185
|
|
$
|
2,790,284
|
|
$
|
2,778,128
|
|
$
|
2,115,721
|
|
$
|
1,863,925
|
|
$
|
0
|
|
$
|
31,410,477
|
|
|
Unboxed - Special
Buy
|
|
1,946,324
|
|
2,289,011
|
|
3,069,934
|
|
2,618,916
|
|
2,815,947
|
|
3,228,047
|
|
2,799,520
|
|
2,783,096
|
|
3,087,000
|
|
2,791,402
|
|
4,689,116
|
|
0
|
|
32,118,313
|
|
|
Wholesale - Fixed
|
|
235
|
|
48,791
|
|
32,550
|
|
0
|
|
0
|
|
0
|
|
56,000
|
|
2,997
|
|
800
|
|
0
|
|
33,904
|
|
0
|
|
175,277
|
|
|
Net Appl. Sales
|
|
$
|
4,701,288
|
|
$
|
5,312,255
|
|
$
|
7,027,765
|
|
$
|
5,342,833
|
|
$
|
5,549,726
|
|
$
|
7,204,122
|
|
$
|
5,629,705
|
|
$
|
5,576,377
|
|
$
|
5,865,928
|
|
$
|
4,907,123
|
|
$
|
6,586,945
|
|
$
|
0
|
|
$
|
63,704,067
|
|
|
Wholesale-Unfixed
|
|
10,090
|
|
3,655
|
|
9,160
|
|
5,540
|
|
7,265
|
|
6,810
|
|
9,580
|
|
5,280
|
|
9,725
|
|
6,415
|
|
9,314
|
|
0
|
|
82,834
|
|
|
Warranty Income
|
|
68,562
|
|
86,525
|
|
118,414
|
|
81,461
|
|
80,653
|
|
106,007
|
|
91,955
|
|
47,638
|
|
(28,072
|
)
|
73,685
|
|
122,298
|
|
0
|
|
849,126
|
|
|
Service &
Labor Income
|
|
2,454
|
|
2,796
|
|
2,514
|
|
2,805
|
|
4,312
|
|
4,185
|
|
2,577
|
|
2,184
|
|
3,466
|
|
587
|
|
1,393
|
|
0
|
|
29,273
|
|
|
Parts S
Accessories Income
|
|
29,018
|
|
47,890
|
|
59,474
|
|
42,597
|
|
44,008
|
|
53,579
|
|
44,189
|
|
45,911
|
|
47,034
|
|
40,903
|
|
45,750
|
|
0
|
|
500,353
|
|
|
Delivery Income
|
|
53,029
|
|
62,830
|
|
90,980
|
|
64,471
|
|
61,186
|
|
81,428
|
|
82,738
|
|
58,945
|
|
66,085
|
|
58,670
|
|
81,039
|
|
0
|
|
761,401
|
|
|
Net Retail
Revenue
|
|
$
|
4,864,441
|
|
$
|
5,515,951
|
|
$
|
7,308,307
|
|
$
|
5,539,707
|
|
$
|
5,747,150
|
|
$
|
7,456,131
|
|
$
|
5,860,744
|
|
$
|
5,736,335
|
|
$
|
5,964,166
|
|
$
|
5,087,383
|
|
$
|
6,846,739
|
|
$
|
0
|
|
$
|
65,927,054
|
|
|
Recycling Revenue
|
|
471,510
|
|
534,745
|
|
887,641
|
|
723,041
|
|
820,566
|
|
1,809,809
|
|
1,817,725
|
|
2,911,087
|
|
4,305,784
|
|
4,551,659
|
|
3,492,365
|
|
0
|
|
22,325,932
|
|
|
By-Product
Revenue
|
|
111,399
|
|
101,087
|
|
136,649
|
|
179,304
|
|
121,886
|
|
184,374
|
|
172,711
|
|
217,669
|
|
384,115
|
|
320,199
|
|
359,798
|
|
0
|
|
2,289,191
|
|
|
TOTAL REVENUE
|
|
$
|
5,447,350
|
|
$
|
6,151,783
|
|
$
|
8,332,597
|
|
$
|
6,442,052
|
|
$
|
6,689,602
|
|
$
|
9,450,314
|
|
$
|
7,851,180
|
|
$
|
8,865,091
|
|
$
|
10,654,065
|
|
$
|
9,959,241
|
|
$
|
10,698,902
|
|
$
|
0
|
|
$
|
90,542,177
|
|
|
|
|
|
|
|
|
|
|
|
|
|
|
|
|
|
|
|
|
|
|
|
|
|
|
|
|
|
|
|
COST OF SALES
|
|
|
|
|
|
|
|
|
|
|
|
|
|
|
|
|
|
|
|
|
|
|
|
|
|
|
|
|
Boxed-New
|
|
2,081,733
|
|
2,205,919
|
|
2,912,680
|
|
2,014,417
|
|
2,043,318
|
|
2,971,612
|
|
2,125,994
|
|
2,173,030
|
|
2,130,879
|
|
1,610,020
|
|
1,404,151
|
|
0
|
|
23,673,753
|
|
|
COGS Percent
|
|
75.6
|
%
|
74.2
|
%
|
74.2
|
%
|
74.0
|
%
|
74.7
|
%
|
74.7
|
%
|
76.6
|
%
|
77.9
|
%
|
76.7
|
%
|
76.1
|
%
|
75.3
|
%
|
0.0
|
%
|
75.4
|
%
|
|
Unboxed - Special
Buy
|
|
1,246,693
|
|
1,441,252
|
|
1,886,450
|
|
1,554,134
|
|
1,668,643
|
|
1,950,776
|
|
1,780,555
|
|
1,744,177
|
|
1,960,214
|
|
1,781,262
|
|
3,120,087
|
|
0
|
|
20,134,243
|
|
|
COGS Percent
|
|
64.1
|
%
|
63.0
|
%
|
61.4
|
%
|
59.3
|
%
|
59.3
|
%
|
60.4
|
%
|
63.6
|
%
|
62.7
|
%
|
63.5
|
%
|
63.8
|
%
|
66.5
|
%
|
0.0
|
%
|
62.7
|
%
|
|
Wholesale - Fixed
|
|
0
|
|
0
|
|
0
|
|
0
|
|
0
|
|
0
|
|
55,901
|
|
2,997
|
|
800
|
|
0
|
|
15,359
|
|
0
|
|
75,057
|
|
|
Manufacturer
Allowances’
|
|
(96,315
|
)
|
(44,614
|
)
|
(189,615
|
)
|
(62,363
|
)
|
(81,547
|
)
|
(364,569
|
)
|
(64,005
|
)
|
(49,824
|
)
|
(298,376
|
)
|
(128,403
|
)
|
(109,236
|
)
|
0
|
|
(1,488,867
|
)
|
|
Early Payment
Discounts
|
|
(45,348
|
)
|
(50,060
|
)
|
(69,144
|
)
|
(76,974
|
)
|
(60,261
|
)
|
(98,528
|
)
|
(85,912
|
)
|
(91,203
|
)
|
(100,097
|
)
|
(114,299
|
)
|
(111,245
|
)
|
0
|
|
(903,071
|
)
|
|
Total Loaded
Product Cost
|
|
$
|
3,186,764
|
|
$
|
3,552,498
|
|
$
|
4,540,372
|
|
$
|
3,429,215
|
|
$
|
3,570,154
|
|
$
|
4,459,292
|
|
$
|
3,812,534
|
|
$
|
3,779,178
|
|
$
|
3,693,421
|
|
$
|
3,148,581
|
|
$
|
4,319,117
|
|
$
|
0
|
|
$
|
41,491,116
|
|
|
Model 63%
|
|
67.8
|
%
|
66.9
|
%
|
64.6
|
%
|
64.2
|
%
|
64.3
|
%
|
61.9
|
%
|
67.7
|
%
|
67.8
|
%
|
63.0
|
%
|
64.2
|
%
|
65.6
|
%
|
0.0
|
%
|
65.1
|
%
|
|
|
|
|
|
|
|
|
|
|
|
|
|
|
|
|
|
|
|
|
|
|
|
|
|
|
|
|
|
|
Service Expense
|
|
34,702
|
|
69,871
|
|
59,023
|
|
49,336
|
|
44,730
|
|
63,187
|
|
49,536
|
|
51,134
|
|
75,243
|
|
54,201
|
|
54,155
|
|
0
|
|
605,118
|
|
|
Delivery Expense
|
|
82,130
|
|
70,853
|
|
80,602
|
|
81,313
|
|
89,256
|
|
140,762
|
|
89,916
|
|
94,938
|
|
118,487
|
|
57,557
|
|
86,001
|
|
0
|
|
991,815
|
|
|
Shipping &
Receiving
|
|
95,398
|
|
110,282
|
|
119,115
|
|
106,003
|
|
108,209
|
|
129,435
|
|
114,359
|
|
123,522
|
|
150,718
|
|
156,379
|
|
183,233
|
|
0
|
|
1,396,653
|
|
|
Freight -
Transfers
|
|
41,726
|
|
54,487
|
|
56,943
|
|
77,665
|
|
40,803
|
|
48,180
|
|
65,681
|
|
52,017
|
|
55,917
|
|
67,709
|
|
78,899
|
|
0
|
|
640,027
|
|
|
Warranty Expense
(Not Ext.
|
|
(4,464
|
)
|
(9,005
|
)
|
(9,201
|
)
|
8,133
|
|
(1,324
|
)
|
(6
|
)
|
(846
|
)
|
(313
|
)
|
(313
|
)
|
(29
|
)
|
199
|
|
0
|
|
(17,169
|
)
|
|
Warranty Claims
(Reimburse
|
|
3,817
|
|
(13,280
|
)
|
(15,858
|
)
|
(17,544
|
)
|
(13,420
|
)
|
(29,696
|
)
|
(20,405
|
)
|
(19,966
|
)
|
(31,652
|
)
|
(50,487
|
)
|
(63,538
|
)
|
0
|
|
(272,029
|
)
|
|
Production (Gain)
Loss
|
|
(36,549
|
)
|
17,141
|
|
17,033
|
|
(33,820
|
)
|
34,891
|
|
(110,733
|
)
|
(123,875
|
)
|
(48,009
|
)
|
(66,855
|
)
|
(64,357
|
)
|
(60,382
|
)
|
0
|
|
(475,515
|
)
|
|
Total Cost of
Other Sales
|
|
216,760
|
|
300,349
|
|
307,657
|
|
271,086
|
|
303,145
|
|
241,129
|
|
174,366
|
|
253,323
|
|
301,545
|
|
220,973
|
|
278,567
|
|
0
|
|
2,868,900
|
|
|
|
|
|
|
|
|
|
|
|
|
|
|
|
|
|
|
|
|
|
|
|
|
|
|
|
|
|
|
|
Inventory
Reserves
|
|
0
|
|
0
|
|
(54,299
|
)
|
(2,193
|
)
|
(15,112
|
)
|
(25
|
)
|
(3,969
|
)
|
(12,265
|
)
|
(3,679
|
)
|
2,107
|
|
(2,835
|
)
|
0
|
|
(92,270
|
)
|
|
Inventory
Adjustments
|
|
(200,668
|
)
|
49,656
|
|
112,114
|
|
(21,892
|
)
|
(2,938
|
)
|
238,974
|
|
(85,665
|
)
|
(156,207
|
)
|
17,762
|
|
14,453
|
|
6,136
|
|
0
|
|
(28,275
|
)
|
|
Total Inventory
Adjustments
|
|
(200,668
|
)
|
49,656
|
|
57,815
|
|
(24,085
|
)
|
(18,050
|
)
|
238,949
|
|
(89,634
|
)
|
(168,472
|
)
|
14,083
|
|
16,560
|
|
3,301
|
|
0
|
|
(120,545
|
)
|
|
Total Cost of
Other Sales & Inventory Adjustments
|
|
$
|
16,092
|
|
$
|
350,005
|
|
$
|
365,472
|
|
$
|
247,001
|
|
$
|
285,095
|
|
$
|
480,078
|
|
$
|
84,732
|
|
$
|
84,851
|
|
$
|
315,628
|
|
$
|
237,533
|
|
$
|
281,868
|
|
$
|
0
|
|
$
|
2,748,355
|
|
|
Model 5%
|
|
0.3
|
%
|
5.7
|
%
|
4.4
|
%
|
3.8
|
%
|
4.3
|
%
|
5.1
|
%
|
1.1
|
%
|
1.0
|
%
|
3.0
|
%
|
2.4
|
%
|
2.6
|
%
|
0.0
|
%
|
3.0
|
%
|
|
Total cost of
retail
|
|
$
|
3,202,856
|
|
$
|
3,902,503
|
|
$
|
4,905,844
|
|
$
|
3,676,216
|
|
$
|
3,855,249
|
|
$
|
4,939,370
|
|
$
|
3,897,266
|
|
$
|
3,864,029
|
|
$
|
4,009,049
|
|
$
|
3,386,114
|
|
$
|
4,600,985
|
|
$
|
0
|
|
$
|
44,239,471
|
|
|
|
|
|
|
|
|
|
|
|
|
|
|
|
|
|
|
|
|
|
|
|
|
|
|
|
|
|
|
|
Processing Costs
|
|
176,998
|
|
151,881
|
|
169,822
|
|
136,389
|
|
130,002
|
|
175,176
|
|
169,602
|
|
224,228
|
|
342,768
|
|
276,969
|
|
287,447
|
|
0
|
|
2,241,282
|
|
|
Transportation
Costs
|
|
226,291
|
|
210,155
|
|
372,463
|
|
269,266
|
|
307,174
|
|
594,106
|
|
581,739
|
|
847,251
|
|
1,441,854
|
|
1,487,530
|
|
1,170,307
|
|
0
|
|
7,508,136
|
|
|
Cost of Utility
Change Out Uni
|
|
0
|
|
0
|
|
136,224
|
|
7,709
|
|
96,703
|
|
508,333
|
|
593,567
|
|
897,075
|
|
1,273,410
|
|
1,835,117
|
|
1,383,593
|
|
0
|
|
6,731,731
|
|
|
Total Recycling
Costs
|
|
$
|
403,289
|
|
$
|
362,036
|
|
$
|
678,509
|
|
$
|
413,364
|
|
$
|
533,879
|
|
$
|
1,277,615
|
|
$
|
1,344,908
|
|
$
|
1,968,554
|
|
$
|
3,058,032
|
|
$
|
3,599,616
|
|
$
|
2,841,347
|
|
$
|
0
|
|
$
|
16,481,149
|
|
|
|
|
|
|
|
|
|
|
|
|
|
|
|
|
|
|
|
|
|
|
|
|
|
|
|
|
|
|
|
Facilities
|
|
(28,239
|
)
|
(30,155
|
)
|
(30,053
|
)
|
(30,081
|
)
|
(30,175
|
)
|
(28,800
|
)
|
(29,069
|
)
|
(21,973
|
)
|
(13,492
|
)
|
6,902
|
|
11,937
|
|
0
|
|
(223,198
|
)
|
|
TOTAL COST OF
REVENUE
|
|
3,577,906
|
|
4,234,384
|
|
5,554,300
|
|
4,059,499
|
|
4,358,953
|
|
6,188,185
|
|
5,213,105
|
|
5,810,610
|
|
7,053,589
|
|
6,992,632
|
|
7,454,269
|
|
0
|
|
60,497,422
|
|
|
GROSS PROFIT
|
|
$
|
1,869,444
|
|
$
|
1,917,399
|
|
$
|
2,778,297
|
|
$
|
2,382,553
|
|
$
|
2,330,649
|
|
$
|
3,262,129
|
|
$
|
2,638,075
|
|
$
|
3,054,481
|
|
$
|
3,600,476
|
|
$
|
2,966,609
|
|
$
|
3,244,633
|
|
$
|
0
|
|
$
|
30,044,755
|
|
|
Model 32%
|
|
34.3
|
%
|
31.2
|
%
|
33.3
|
%
|
37.0
|
%
|
34.8
|
%
|
34.5
|
%
|
33.6
|
%
|
34.5
|
%
|
33.8
|
%
|
29.8
|
%
|
30.3
|
%
|
0.0
|
%
|
33.2
|
%
|
1
Appliance Recycling Centers
of America, Inc.
Consolidated
Income Statement
For the Month Ending
November 24, 2007
|
|
|
|
|
|
|
|
|
|
|
|
|
|
|
|
|
|
|
|
|
|
|
|
|
|
|
|
|
|
|
|
|
|
|
|
|
|
|
|
|
|
|
|
|
JAN
|
|
FEB
|
|
MAR
|
|
APR
|
|
MAY
|
|
JUN
|
|
JUL
|
|
AUG
|
|
SEP
|
|
OCT
|
|
NOV
|
|
DEC
|
|
TOTAL
|
|
|
GROSS PROFIT
|
|
1,869,444
|
|
1,917,399
|
|
2,778,297
|
|
2,382,553
|
|
2,330,649
|
|
3,262,129
|
|
2,638,075
|
|
3,054,481
|
|
3,600,476
|
|
2,966,609
|
|
3,244,633
|
|
0
|
|
30,044,755
|
|
|
Model 32%
|
|
34.3
|
%
|
31.2
|
%
|
33.3
|
%
|
37.0
|
%
|
34.8
|
%
|
34.5
|
%
|
33.6
|
%
|
34.5
|
%
|
33.8
|
%
|
29.8
|
%
|
30.3
|
%
|
0.0
|
%
|
33.2
|
%
|
|
|
|
|
|
|
|
|
|
|
|
|
|
|
|
|
|
|
|
|
|
|
|
|
|
|
|
|
|
|
Advertising
Expense
|
|
329,284
|
|
408,774
|
|
355,334
|
|
394,240
|
|
415,191
|
|
429,884
|
|
411,563
|
|
381,898
|
|
343,306
|
|
321,432
|
|
376,169
|
|
0
|
|
4,167,075
|
|
|
Advertising
Rebate
|
|
(10,000
|
)
|
(4,047
|
)
|
(20,000
|
)
|
0
|
|
0
|
|
(25,979
|
)
|
(30,000
|
)
|
0
|
|
0
|
|
(5,500
|
)
|
0
|
|
0
|
|
(95,526
|
)
|
|
Net Advertising
Expense
|
|
$
|
319,284
|
|
$
|
404,727
|
|
$
|
335,334
|
|
$
|
394,240
|
|
$
|
415,191
|
|
$
|
403,905
|
|
$
|
381,563
|
|
$
|
381,898
|
|
$
|
343,306
|
|
$
|
315,932
|
|
$
|
376,169
|
|
$
|
0
|
|
$
|
4,071,549
|
|
|
Model 3%
|
|
5.9
|
%
|
6.6
|
%
|
4.0
|
%
|
6.1
|
%
|
6.2
|
%
|
4.3
|
%
|
4.9
|
%
|
4.3
|
%
|
3.2
|
%
|
3.2
|
%
|
3.5
|
%
|
0.0
|
%
|
4.5
|
%
|
|
|
|
|
|
|
|
|
|
|
|
|
|
|
|
|
|
|
|
|
|
|
|
|
|
|
|
|
|
|
Occupancy
Expenses
|
|
354,452
|
|
365,921
|
|
390,492
|
|
373,746
|
|
380,920
|
|
368,457
|
|
333,821
|
|
307,930
|
|
369,934
|
|
302,933
|
|
338,423
|
|
0
|
|
3,887,029
|
|
|
Model 6%
|
|
6.5
|
%
|
5.9
|
%
|
4.7
|
%
|
5.8
|
%
|
5.7
|
%
|
3.9
|
%
|
4.3
|
%
|
3.5
|
%
|
3.5
|
%
|
3.0
|
%
|
3.2
|
%
|
0.0
|
%
|
4.3
|
%
|
|
Retail Store
Selling
Expenses
|
|
889,207
|
|
756,207
|
|
998,647
|
|
659,536
|
|
571,682
|
|
1,041,734
|
|
829,080
|
|
879,991
|
|
904,665
|
|
788,753
|
|
788,001
|
|
0
|
|
9,107,503
|
|
|
Model 10%
|
|
16.3
|
%
|
12.3
|
%
|
12.0
|
%
|
10.2
|
%
|
8.5
|
%
|
11.0
|
%
|
10.6
|
%
|
9.9
|
%
|
8.5
|
%
|
7.9
|
%
|
7.4
|
%
|
00
|
%
|
10.1
|
%
|
|
Total Retail
Store
Expenses
|
|
$
|
1,243,659
|
|
$
|
1,122,128
|
|
$
|
1,389,139
|
|
$
|
1,033,282
|
|
$
|
952,602
|
|
$
|
1,410,191
|
|
$
|
1,162,901
|
|
$
|
1,187,921
|
|
$
|
1,274,599
|
|
$
|
1.091.686
|
|
$
|
1.126.424
|
|
$
|
0
|
|
$
|
12.994.532
|
|
|
TOTAL SELLING
EXPENSES
|
|
$
|
1,562,943
|
|
$
|
1,526,855
|
|
$
|
1,724,473
|
|
$
|
1,427,522
|
|
$
|
1,367,793
|
|
$
|
1,814,096
|
|
$
|
1,544,464
|
|
$
|
1,569,819
|
|
$
|
1,617,905
|
|
$
|
1,407,618
|
|
$
|
1,502,593
|
|
$
|
0
|
|
$
|
17,066,081
|
|
|
Model 19%
|
|
28.7
|
%
|
24.8
|
%
|
20.7
|
%
|
22.2
|
%
|
20.4
|
%
|
19.2
|
%
|
19.7
|
%
|
17.7
|
%
|
15.2
|
%
|
14.1
|
%
|
14.0
|
%
|
0.0
|
%
|
18.8
|
%
|
|
|
|
|
|
|
|
|
|
|
|
|
|
|
|
|
|
|
|
|
|
|
|
|
|
|
|
|
|
|
Center G&A
Expenses
|
|
139,118
|
|
196,916
|
|
431,774
|
|
292,849
|
|
314,503
|
|
365,884
|
|
324,373
|
|
441,583
|
|
601,628
|
|
518,554
|
|
425,702
|
|
0
|
|
4,052,884
|
|
|
Alloc IN CTR
G&A
Expenses
|
|
22,991
|
|
36,342
|
|
62,288
|
|
72,288
|
|
59,844
|
|
67,920
|
|
93,493
|
|
101,604
|
|
89,304
|
|
62,060
|
|
66,215
|
|
0
|
|
734,349
|
|
|
Alloc OUT
CTRG&A
Expense
|
|
(22,991
|
)
|
(36,342
|
)
|
(62,288
|
)
|
(72,288
|
)
|
(59,844
|
)
|
(67,920
|
)
|
(93,493
|
)
|
(101,604
|
)
|
(89,304
|
)
|
(62,060
|
)
|
(66,215
|
)
|
0
|
|
(734,349
|
)
|
|
TOTAL CENTER
G&A EXPE
|
|
$
|
139,118
|
|
$
|
196,916
|
|
$
|
431,774
|
|
$
|
292,849
|
|
$
|
314,503
|
|
$
|
365,884
|
|
$
|
324,373
|
|
$
|
441,583
|
|
$
|
601,628
|
|
$
|
518,554
|
|
$
|
425,702
|
|
$
|
0
|
|
$
|
4,052,884
|
|
|
Model 2%
|
|
2.6
|
%
|
3.2
|
%
|
5.2
|
%
|
4.5
|
%
|
4.7
|
%
|
3.9
|
%
|
4.1
|
%
|
5.0
|
%
|
5.6
|
%
|
5.2
|
%
|
4.0
|
%
|
0.0
|
%
|
4.5
|
%
|
|
|
|
|
|
|
|
|
|
|
|
|
|
|
|
|
|
|
|
|
|
|
|
|
|
|
|
|
|
|
INCOME BEFORE
CORPOR
|
|
167,383
|
|
193,628
|
|
622,050
|
|
662,182
|
|
648,353
|
|
1,082,149
|
|
769,238
|
|
1,043,079
|
|
1,380,943
|
|
1,040,437
|
|
1,316,338
|
|
0
|
|
8,925,790
|
|
|
|
|
|
|
|
|
|
|
|
|
|
|
|
|
|
|
|
|
|
|
|
|
|
|
|
|
|
|
|
CORPORATE
ALLOCATIONS
|
|
|
|
|
|
|
|
|
|
|
|
|
|
|
|
|
|
|
|
|
|
|
|
|
|
|
|
|
Corporate G&A
Expenses
|
|
326,900
|
|
343,019
|
|
488,462
|
|
340,633
|
|
365,552
|
|
480,592
|
|
402,861
|
|
413,353
|
|
543,463
|
|
398,575
|
|
534,373
|
|
0
|
|
4,637,783
|
|
|
Alloc IN IS
Expenses
|
|
86,029
|
|
93,350
|
|
115,623
|
|
99,666
|
|
104,519
|
|
138,814
|
|
115,009
|
|
129,316
|
|
125,296
|
|
109,033
|
|
122,906
|
|
0
|
|
1,239,561
|
|
|
Alloc OUT IS
Expenses
|
|
(85,926
|
)
|
(93,350
|
)
|
(115,623
|
)
|
(99,666
|
)
|
(104,519
|
)
|
(138,814
|
)
|
(115,009
|
)
|
(129,316
|
)
|
(125,296
|
)
|
(109,033
|
)
|
(122,906
|
)
|
0
|
|
(1,239,458
|
)
|
|
Alloc IN HR
Expenses
|
|
27,766
|
|
20,170
|
|
31,537
|
|
26,444
|
|
29,238
|
|
46,953
|
|
29,850
|
|
18,866
|
|
32,378
|
|
26,305
|
|
23,079
|
|
0
|
|
312,586
|
|
|
Alloc OUT HR
Expenses
|
|
(27,869
|
)
|
(20,170
|
)
|
(31,537
|
)
|
(26,444
|
)
|
(29,238
|
)
|
(46,953
|
)
|
(29,850
|
)
|
(18,866
|
)
|
(32,378
|
)
|
(26,305
|
)
|
(23,079
|
)
|
0
|
|
(312,689
|
)
|
|
Alloc IN Retail
Sales
Exp
|
|
10,290
|
|
15,862
|
|
18,830
|
|
15,948
|
|
15,512
|
|
17,414
|
|
13,924
|
|
20,013
|
|
27,983
|
|
14,238
|
|
13,786
|
|
0
|
|
183,800
|
|
|
Alloc OUT Retail
Sales Exp
|
|
(10,290
|
)
|
(15,862
|
)
|
(18,830
|
)
|
(15,948
|
)
|
(15,512
|
)
|
(17,414
|
)
|
(13,924
|
)
|
(20,013
|
)
|
(27,983
|
)
|
(14,238
|
)
|
(13,786
|
)
|
0
|
|
(183,800
|
)
|
|
Alloc IN Retail
Operations Exp
|
|
14,582
|
|
15,416
|
|
2,231
|
|
0
|
|
0
|
|
0
|
|
0
|
|
0
|
|
0
|
|
0
|
|
0
|
|
0
|
|
32,229
|
|
|
Alloc OUT Retail
Operations
|
|
(14,582
|
)
|
(15,416
|
)
|
(2,231
|
)
|
0
|
|
0
|
|
0
|
|
0
|
|
0
|
|
0
|
|
0
|
|
0
|
|
0
|
|
(32,229
|
)
|
|
Alloc IN Corp.
Admin Expens
|
|
100,473
|
|
110,050
|
|
135,945
|
|
110,329
|
|
118,135
|
|
197,411
|
|
117,618
|
|
110,197
|
|
204,984
|
|
111,047
|
|
133,699
|
|
0
|
|
1,449,888
|
|
|
Alloc OUT Corp.
Admin. Expe
|
|
(100,473
|
)
|
(110,050
|
)
|
(135,945
|
)
|
(110,329
|
)
|
(118,135
|
)
|
(197,411
|
)
|
(117,618
|
)
|
(110,197
|
)
|
(204,984
|
)
|
(111,047
|
)
|
(133,699
|
)
|
0
|
|
(1,449,888
|
)
|
|
Alloc IN
Accounting
Expenses
|
|
39,689
|
|
58,529
|
|
70,452
|
|
54,049
|
|
44,304
|
|
49,586
|
|
61,545
|
|
58,801
|
|
64,360
|
|
50,270
|
|
47,010
|
|
0
|
|
598,595
|
|
|
Alloc OUT
Accounting
Expen
|
|
(39,689
|
)
|
(58,529
|
)
|
(70,452
|
)
|
(54,049
|
)
|
(44,304
|
)
|
(49,586
|
)
|
(61,545
|
)
|
(58,801
|
)
|
(64,360
|
)
|
(50,270
|
)
|
(47,010
|
)
|
0
|
|
(598,595
|
)
|
|
Alloc IN Program
Coordination
|
|
0
|
|
0
|
|
0
|
|
0
|
|
13,694
|
|
14,024
|
|
12,073
|
|
17,381
|
|
20,158
|
|
20,081
|
|
20,769
|
|
0
|
|
118,180
|
|
|
Alloc OUT Program
Coordinat
|
|
0
|
|
0
|
|
0
|
|
0
|
|
(13,694
|
)
|
(14,024
|
)
|
(12,073
|
)
|
(17,381
|
)
|
(20,158
|
)
|
(20,081
|
)
|
(20,769
|
)
|
0
|
|
(118,180
|
)
|
|
Alloc IN Business
Developme
|
|
0
|
|
0
|
|
0
|
|
0
|
|
8,336
|
|
8,669
|
|
17,107
|
|
26,897
|
|
33,066
|
|
23,551
|
|
23,808
|
|
0
|
|
141,434
|
|
|
Alloc OUT
Business
Develop
|
|
0
|
|
0
|
|
0
|
|
0
|
|
(8,336
|
)
|
(8,669
|
)
|
(17,107
|
)
|
(26,897
|
)
|
(33,066
|
)
|
(23,551
|
)
|
(23,808
|
)
|
0
|
|
(141,434
|
)
|
|
Alloc IN
Logistics
|
|
0
|
|
0
|
|
0
|
|
0
|
|
0
|
|
12,474
|
|
13,871
|
|
11,874
|
|
15,490
|
|
13,011
|
|
13,239
|
|
0
|
|
79,959
|
|
|
Alloc OUT
Logistics
|
|
0
|
|
0
|
|
0
|
|
0
|
|
0
|
|
(12,474
|
)
|
(13,871
|
)
|
(11,874
|
)
|
(15,490
|
)
|
(13,011
|
)
|
(13,239
|
)
|
0
|
|
(79,959
|
)
|
|
TOTAL CORP
G&A
EXPENS
|
|
$
|
326,900
|
|
$
|
343,019
|
|
$
|
488,462
|
|
$
|
340,633
|
|
$
|
365,552
|
|
$
|
480,592
|
|
$
|
402,861
|
|
$
|
413,353
|
|
$
|
543,463
|
|
$
|
398,575
|
|
$
|
534,373
|
|
$
|
0
|
|
$
|
4,637,783
|
|
|
Model 4%
|
|
6.0
|
%
|
5.6
|
%
|
5.9
|
%
|
5.3
|
%
|
5.5
|
%
|
5.1
|
%
|
5.1
|
%
|
4.7
|
%
|
5.1
|
%
|
4.0
|
%
|
5.0
|
%
|
0.0
|
%
|
5.1
|
%
|
|
OPERATING
INCOME
|
|
$
|
(159,517
|
)
|
$
|
(149,391
|
)
|
$
|
133,588
|
|
$
|
321,549
|
|
$
|
282,801
|
|
$
|
601,557
|
|
$
|
366,377
|
|
$
|
629,726
|
|
$
|
837,480
|
|
$
|
641,862
|
|
$
|
781,965
|
|
$
|
0
|
|
$
|
4,288,007
|
|
|
Model 7%
|
|
-2.9
|
%
|
-2.4
|
%
|
1.6
|
%
|
5.0
|
%
|
4.2
|
%
|
6.4
|
%
|
4.7
|
%
|
7.1
|
%
|
7.9
|
%
|
6.4
|
%
|
7.3
|
%
|
0.0
|
%
|
4.7
|
%
|
|
|
|
|
|
|
|
|
|
|
|
|
|
|
|
|
|
|
|
|
|
|
|
|
|
|
|
|
|
|
Other Income
(Expenses)
|
|
(8,364
|
)
|
44
|
|
10,006
|
|
(17,510
|
)
|
8,258
|
|
(36,799
|
)
|
(3,120
|
)
|
(5,361
|
)
|
20,419
|
|
(876
|
)
|
(3,581
|
)
|
0
|
|
(36,884
|
)
|
|
|
|
|
|
|
|
|
|
|
|
|
|
|
|
|
|
|
|
|
|
|
|
|
|
|
|
|
|
|
Interest Income
|
|
0
|
|
0
|
|
0
|
|
0
|
|
0
|
|
0
|
|
0
|
|
16,606
|
|
1,383
|
|
0
|
|
1,715
|
|
0
|
|
19,704
|
|
|
Interest Expense
|
|
(103,282
|
)
|
(96,438
|
)
|
(98,491
|
)
|
(98,101
|
)
|
(110,496
|
)
|
(115,103
|
)
|
(128,406
|
)
|
(136,061
|
)
|
(129,781
|
)
|
(151,585
|
)
|
(154,069
|
)
|
0
|
|
(1,321,813
|
)
|
|
Model 1%
|
|
-1.9
|
%
|
-1.6
|
%
|
-1.2
|
%
|
-1.5
|
%
|
-1.7
|
%
|
-1.2
|
%
|
-1.6
|
%
|
-1.5
|
%
|
-1.2
|
%
|
-1.5
|
%
|
-1.4
|
%
|
00
|
%
|
-1.5
|
%
|
|
INC BEFORE
MGMT FEE, IN
|
|
$
|
(271,163
|
)
|
$
|
(245,785
|
)
|
$
|
45,103
|
|
$
|
205,938
|
|
$
|
180,563
|
|
$
|
449,655
|
|
$
|
234,851
|
|
$
|
504,910
|
|
$
|
729,501
|
|
$
|
489,401
|
|
$
|
626,030
|
|
$
|
0
|
|
$
|
2,949,014
|
|
|
INC BEFORE
INCOME TAX
|
|
$
|
(271,163
|
)
|
$
|
(245,785
|
)
|
$
|
45,103
|
|
$
|
205,938
|
|
$
|
180,563
|
|
$
|
449,655
|
|
$
|
234,851
|
|
$
|
504,910
|
|
$
|
729,501
|
|
$
|
489,401
|
|
$
|
626,030
|
|
$
|
0
|
|
$
|
2,949,014
|
|
|
Model 6%
|
|
-5.0
|
%
|
-4.0
|
%
|
0.5
|
%
|
3.2
|
%
|
2.7
|
%
|
4.8
|
%
|
3.0
|
%
|
5.7
|
%
|
6.8
|
%
|
4.9
|
%
|
5.9
|
%
|
0.0
|
%
|
3.3
|
%
|
|
|
|
|
|
|
|
|
|
|
|
|
|
|
|
|
|
|
|
|
|
|
|
|
|
|
|
|
|
|
Provision for
(Benefit
of) lnco
|
|
0
|
|
0
|
|
0
|
|
0
|
|
0
|
|
0
|
|
0
|
|
873
|
|
64,719
|
|
0
|
|
0
|
|
0
|
|
65,592
|
|
|
Model 2.4%
|
|
0.0
|
%
|
0.0
|
%
|
0.0
|
%
|
0.0
|
%
|
0.0
|
%
|
0.0
|
%
|
0.0
|
%
|
0.0
|
%
|
0.6
|
%
|
0.0
|
%
|
0.0
|
%
|
0.0
|
%
|
0.1
|
%
|
|
NET INCOME
|
|
$
|
(271,163
|
)
|
$
|
(245,785
|
)
|
$
|
45,103
|
|
$
|
205,938
|
|
$
|
180,563
|
|
$
|
449,655
|
|
$
|
234,851
|
|
$
|
504,037
|
|
$
|
664,782
|
|
$
|
489,401
|
|
$
|
626,030
|
|
$
|
0
|
|
$
|
2,883,422
|
|
|
Model 3.6%
|
|
-5.0
|
%
|
-4.0
|
%
|
0.5
|
%
|
3.2
|
%
|
2.7
|
%
|
4.8
|
%
|
3.0
|
%
|
5.7
|
%
|
6.2
|
%
|
4.9
|
%
|
5.9
|
%
|
0.0
|
%
|
3.2
|
%
|
|
Computer check
net
profit
|
|
(271,162
|
)
|
(245,783
|
)
|
45,104
|
|
205,944
|
|
180,565
|
|
449,654
|
|
234,853
|
|
504,036
|
|
664,782
|
|
489,402
|
|
626,030
|
|
0
|
|
2,883,425
|
|
2
Appliance Recycling
Centers of America, Inc.
Consolidated Balance
Sheet
For the Eleven Months
Ending November 24, 2007
|
|
|
November
|
|
2007
|
|
|
|
|
|
|
|
|
|
ASSETS
|
|
|
|
|
|
|
Current Assets
|
|
|
|
|
|
|
Cash in Bank
|
|
$
|
860,686.23
|
|
$
|
1,421,790.62
|
|
|
Accounts
Receivable
|
|
816,044.25
|
|
11,065,509.48
|
|
|
Accounts
Receivable - Intercompany
|
|
0.00
|
|
0.00
|
|
|
Inventories
|
|
127,927.29
|
|
12,466,207.34
|
|
|
Prepaid Assets
|
|
(275,621.33
|
)
|
1,535,257.56
|
|
|
|
|
|
|
|
|
|
Total Current
Assets
|
|
1,529,036.44
|
|
26,488,765.00
|
|
|
|
|
|
|
|
|
|
PROPERTY AND
EQUIPMENT
|
|
|
|
|
|
|
Land
|
|
0.00
|
|
2,050,264.50
|
|
|
Building &
Improvements
|
|
114,011.25
|
|
4,939,932.26
|
|
|
Equipment
|
|
50,023.02
|
|
7,696,994.40
|
|
|
|
|
|
|
|
|
|
Total
|
|
164,034.27
|
|
14,687,191.16
|
|
|
Accumulated
Depreciation
|
|
(77,426.51
|
)
|
(8,303,005.37
|
)
|
|
|
|
|
|
|
|
|
Net
Property & Equipment
|
|
86,607.76
|
|
6,384,185.79
|
|
|
|
|
|
|
|
|
|
Long Term
Prepaids, net
|
|
3,957.60
|
|
456,907.18
|
|
|
Goodwill, net
|
|
0.00
|
|
99,547.49
|
|
|
Investment in
Subsidiary
|
|
0.00
|
|
600.00
|
|
|
|
|
|
|
|
|
|
TOTAL ASSETS
|
|
1,619,601.80
|
|
33,430,005.46
|
|
|
|
|
|
|
|
|
|
LIABILITIES &
SHAREHOLDERS’ EQUITY
|
|
|
|
|
|
|
Current
Liabilities
|
|
|
|
|
|
|
Line of Credit
|
|
$
|
422,366.64
|
|
$
|
13,260,015.60
|
|
|
Current
Maturities of Long Term Debt
|
|
0.00
|
|
364,237.28
|
|
|
Accounts Payable
Trade
|
|
(87,025.44
|
)
|
3,089,232.19
|
|
|
Accounts Payable
- Intercompany
|
|
0.00
|
|
(447.70
|
)
|
|
Accrued Expenses
|
|
519,207.89
|
|
4,198,272.65
|
|
|
Unrecognized
Gain
|
|
21,571.08
|
|
132,071.64
|
|
|
Accrued Income
Taxes
|
|
0.00
|
|
103,933.19
|
|
|
|
|
|
|
|
|
|
Total Current
Liabilties
|
|
876,120.17
|
|
21,147,314.85
|
|
|
|
|
|
|
|
|
|
Long Term Debt
|
|
|
|
|
|
|
Notes &
Contracts Payable
|
|
(6,060.03
|
)
|
5,123,208.10
|
|
|
Less Current
Maturity
|
|
0.00
|
|
(364,237.28
|
)
|
|
|
|
|
|
|
|
|
Total Long Term
Debt
|
|
(6,060.03
|
)
|
4,758,970.82
|
|
|
|
|
|
|
|
|
|
TOTAL
LIABILITIES
|
|
870,060.14
|
|
25,906,285.67
|
|
|
|
|
|
|
|
|
|
Stockholders’
Equity
|
|
|
|
|
|
|
Capital Stock
|
|
161,100.00
|
|
15,440,370.39
|
|
|
Retained
Earnings
|
|
0.00
|
|
(10,827,640.29
|
)
|
|
Current Earnings
|
|
626,029.62
|
|
2,883,423.19
|
|
|
Other
Comprehensive Income
|
|
|
|
|
|
|
Translation
Exchange
|
|
(37,587.96
|
)
|
27,566.50
|
|
|
|
|
|
|
|
|
|
Total
Stockholders’ Equity
|
|
749,541.66
|
|
7,523,719.79
|
|
|
|
|
|
|
|
|
|
TOTAL
LIABILITIES & SHAREHOLDER’S EQUITY
|
|
1,619,601.80
|
|
33,430,005.46
|
|
|
|
|
|
|
|
|
|
Working Capital
|
|
652,916.27
|
|
5,341,450.15
|
|
|
|
|
|
|
|
|
|
Quick Ratio
|
|
1.91
|
|
0.59
|
|
|
|
|
|
|
|
|
|
Current Ratio
|
|
1.75
|
|
1.25
|
|
|
|
|
|
|
|
|
|
Current
Liabilities to Inventory
|
|
6.85
|
|
1.70
|
|
3
Appliance
Recycling Centers of America (ARCA) Confidential
ARCA
Corporate Organization